Tables
Instant Visualization
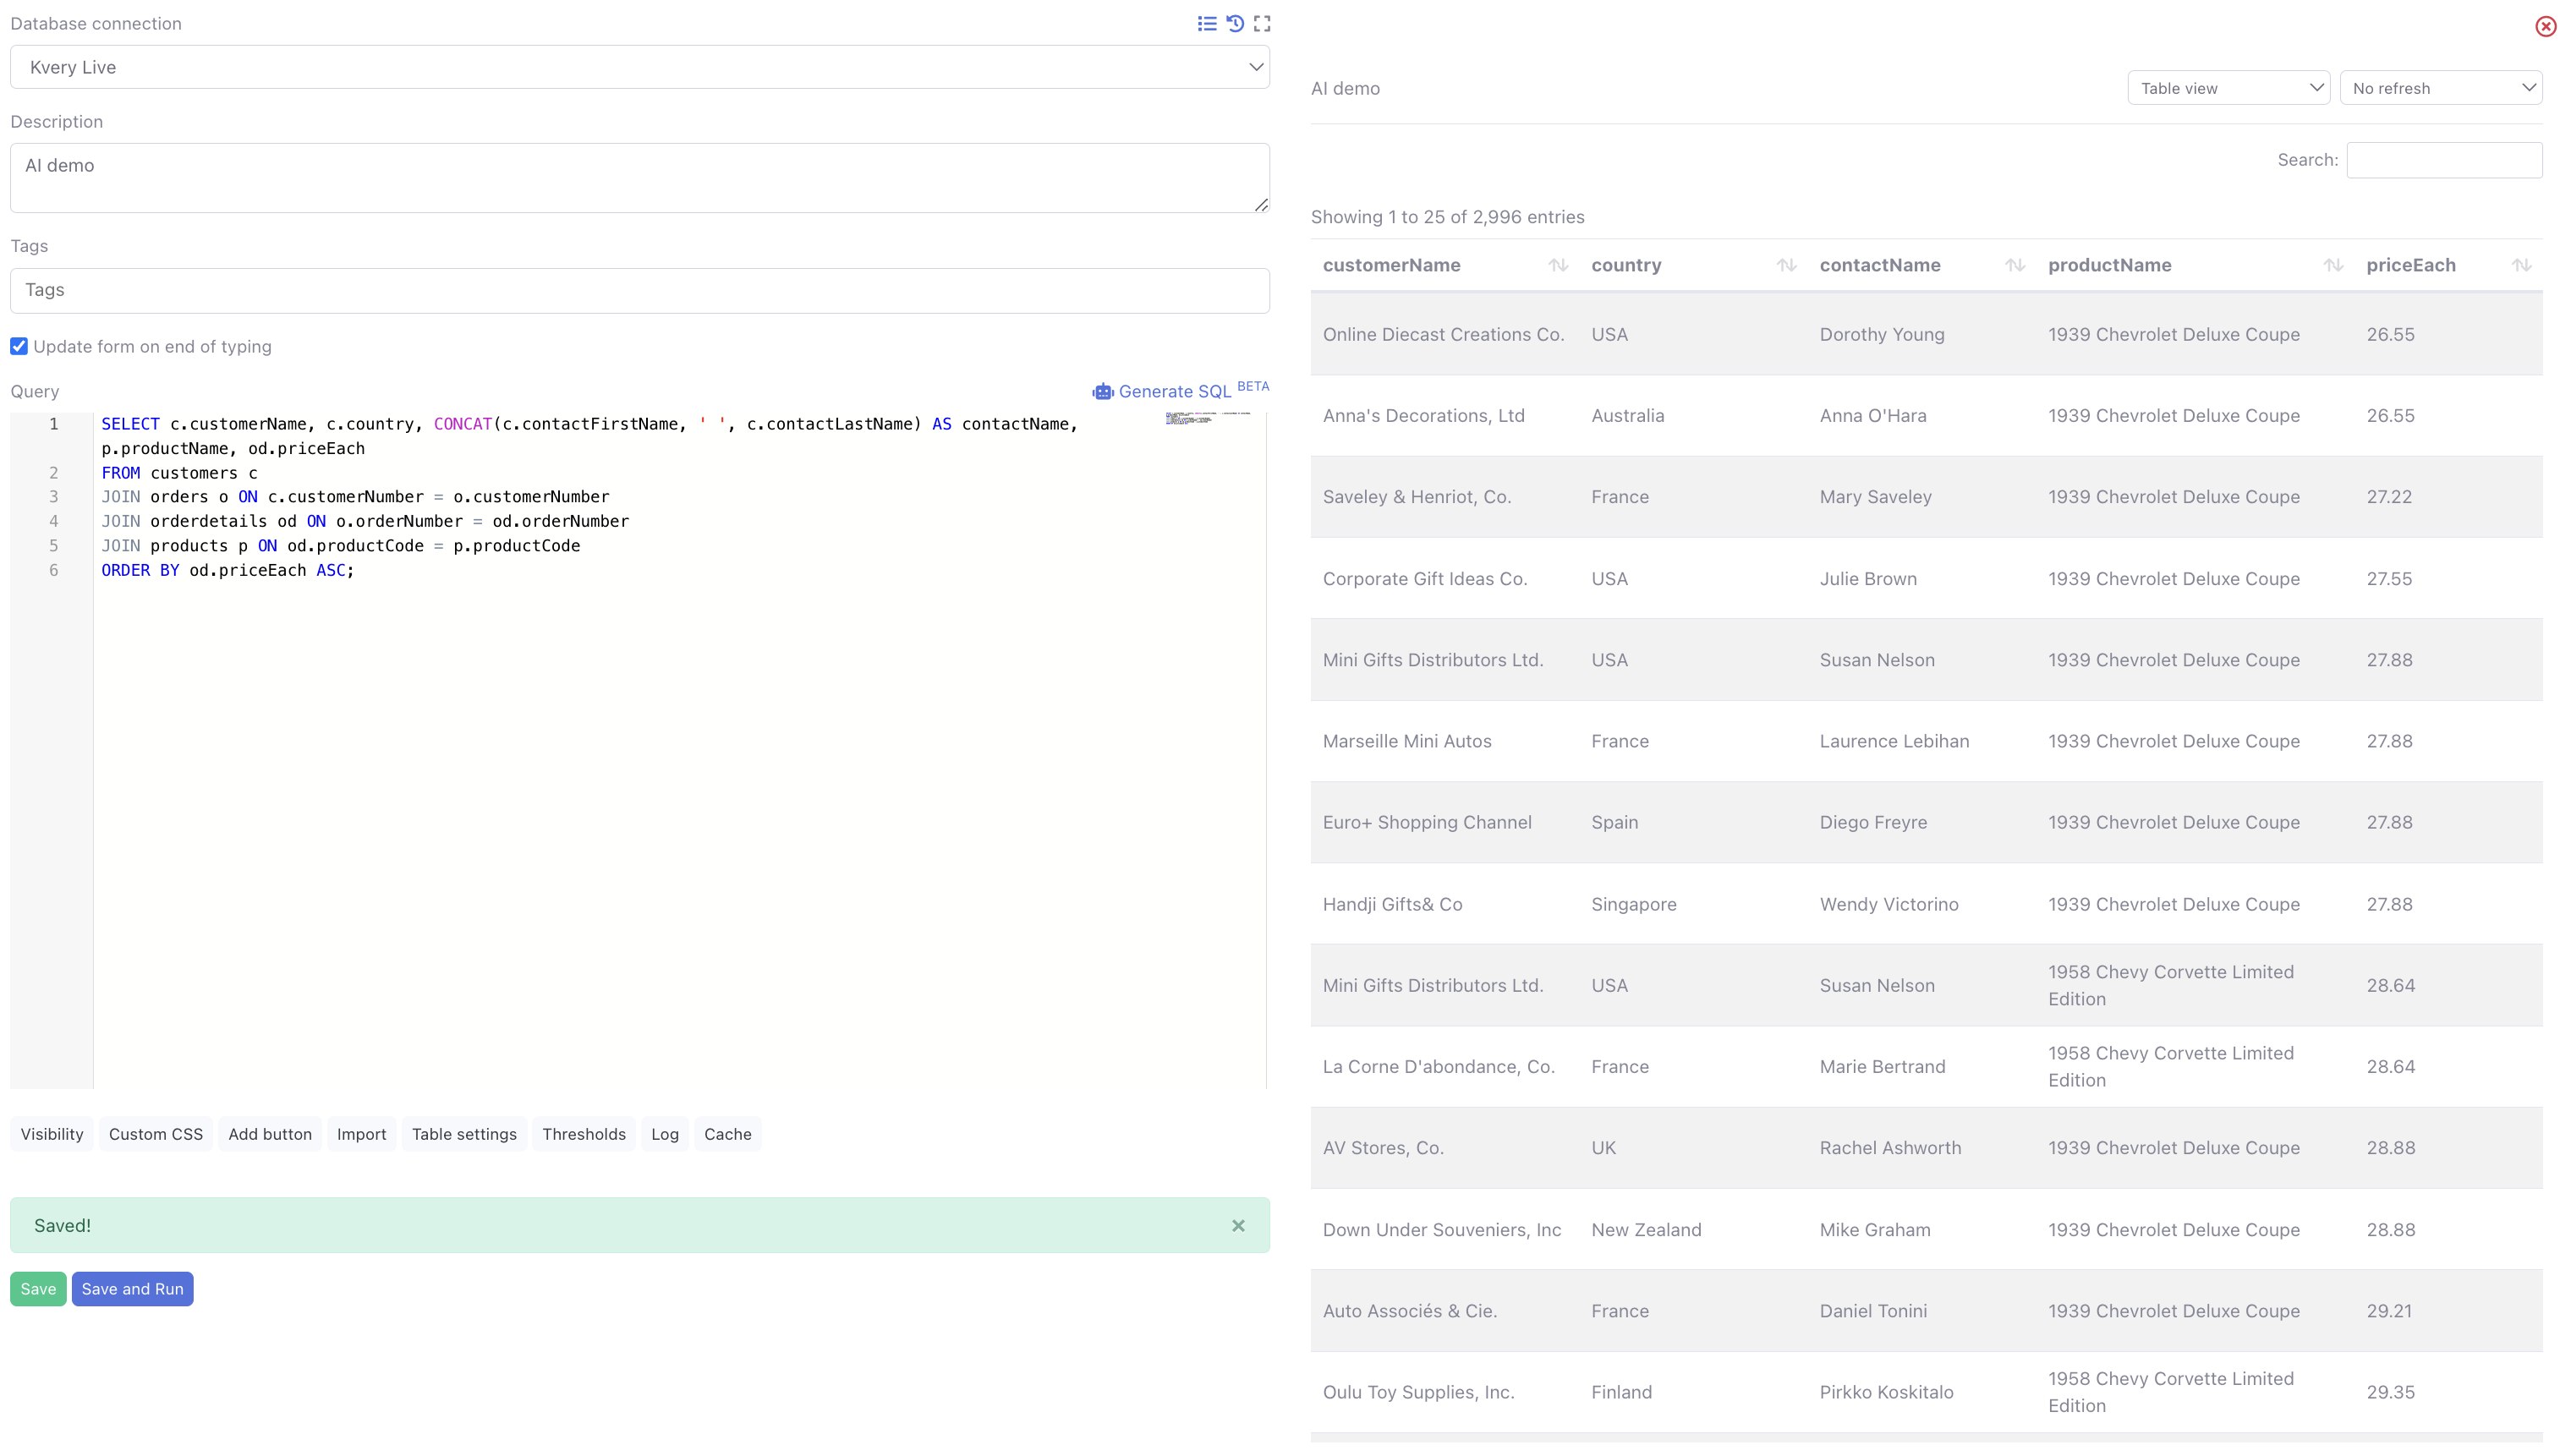
As soon as a query is executed, the results are visualized in a table format on the right-hand side of the screen. This real-time feedback is essential for quick analysis and iteration.
Data Organization
The results are organized in rows and columns, mirroring the structure of a standard database table. This familiar layout makes it easy to read and interpret the data.
Sorting
Users can sort the data by clicking on column headers, which helps in quickly organizing the data in ascending or descending order.
Filtering
Kvery allows filtering data directly within the table, enhancing the user’s ability to focus on specific subsets of data.