Line Chart
Line charts are a fundamental tool in data visualization, used extensively for displaying trends over time. They are particularly effective in showing changes in values across continuous data points.
Structure
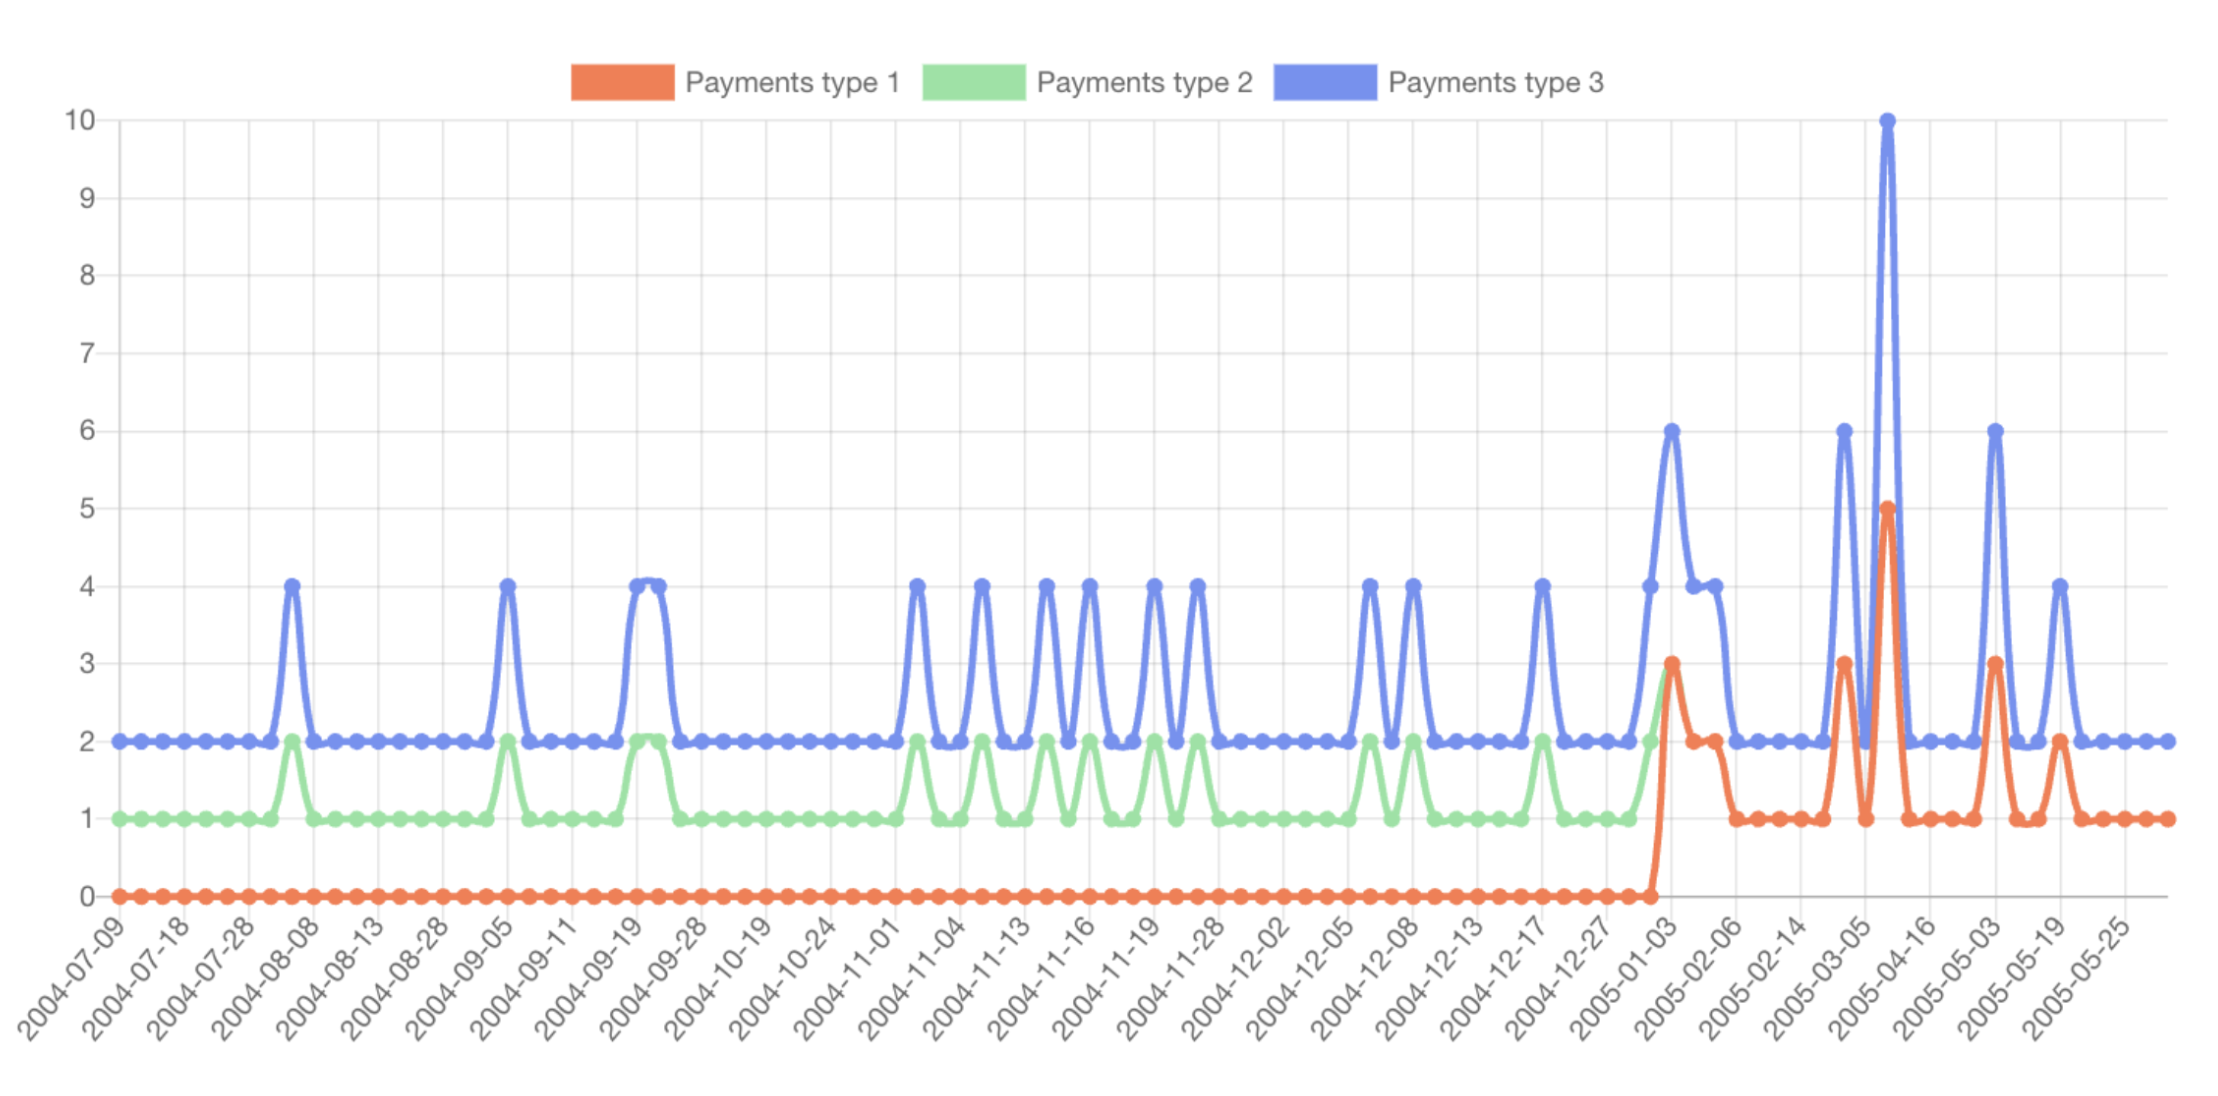
A line chart is represented by a series of data points (‘markers’) connected by straight line segments. The x-axis typically represents the time intervals or continuous categories, while the y-axis indicates the values.
Data Representation
Each data point on the chart corresponds to a value in your data set. Connecting these points with lines makes it easy to track changes and trends over time.
Trend Analysis
Ideal for visualizing trends in data over time, such as sales figures, stock prices, or temperature changes. Useful in identifying patterns, such as seasonal effects, growth rates, or declines.
Customization Options
Similar to other charts, with options to change line colors, add labels, decide whether the lines are stacked, and choose the datasets.