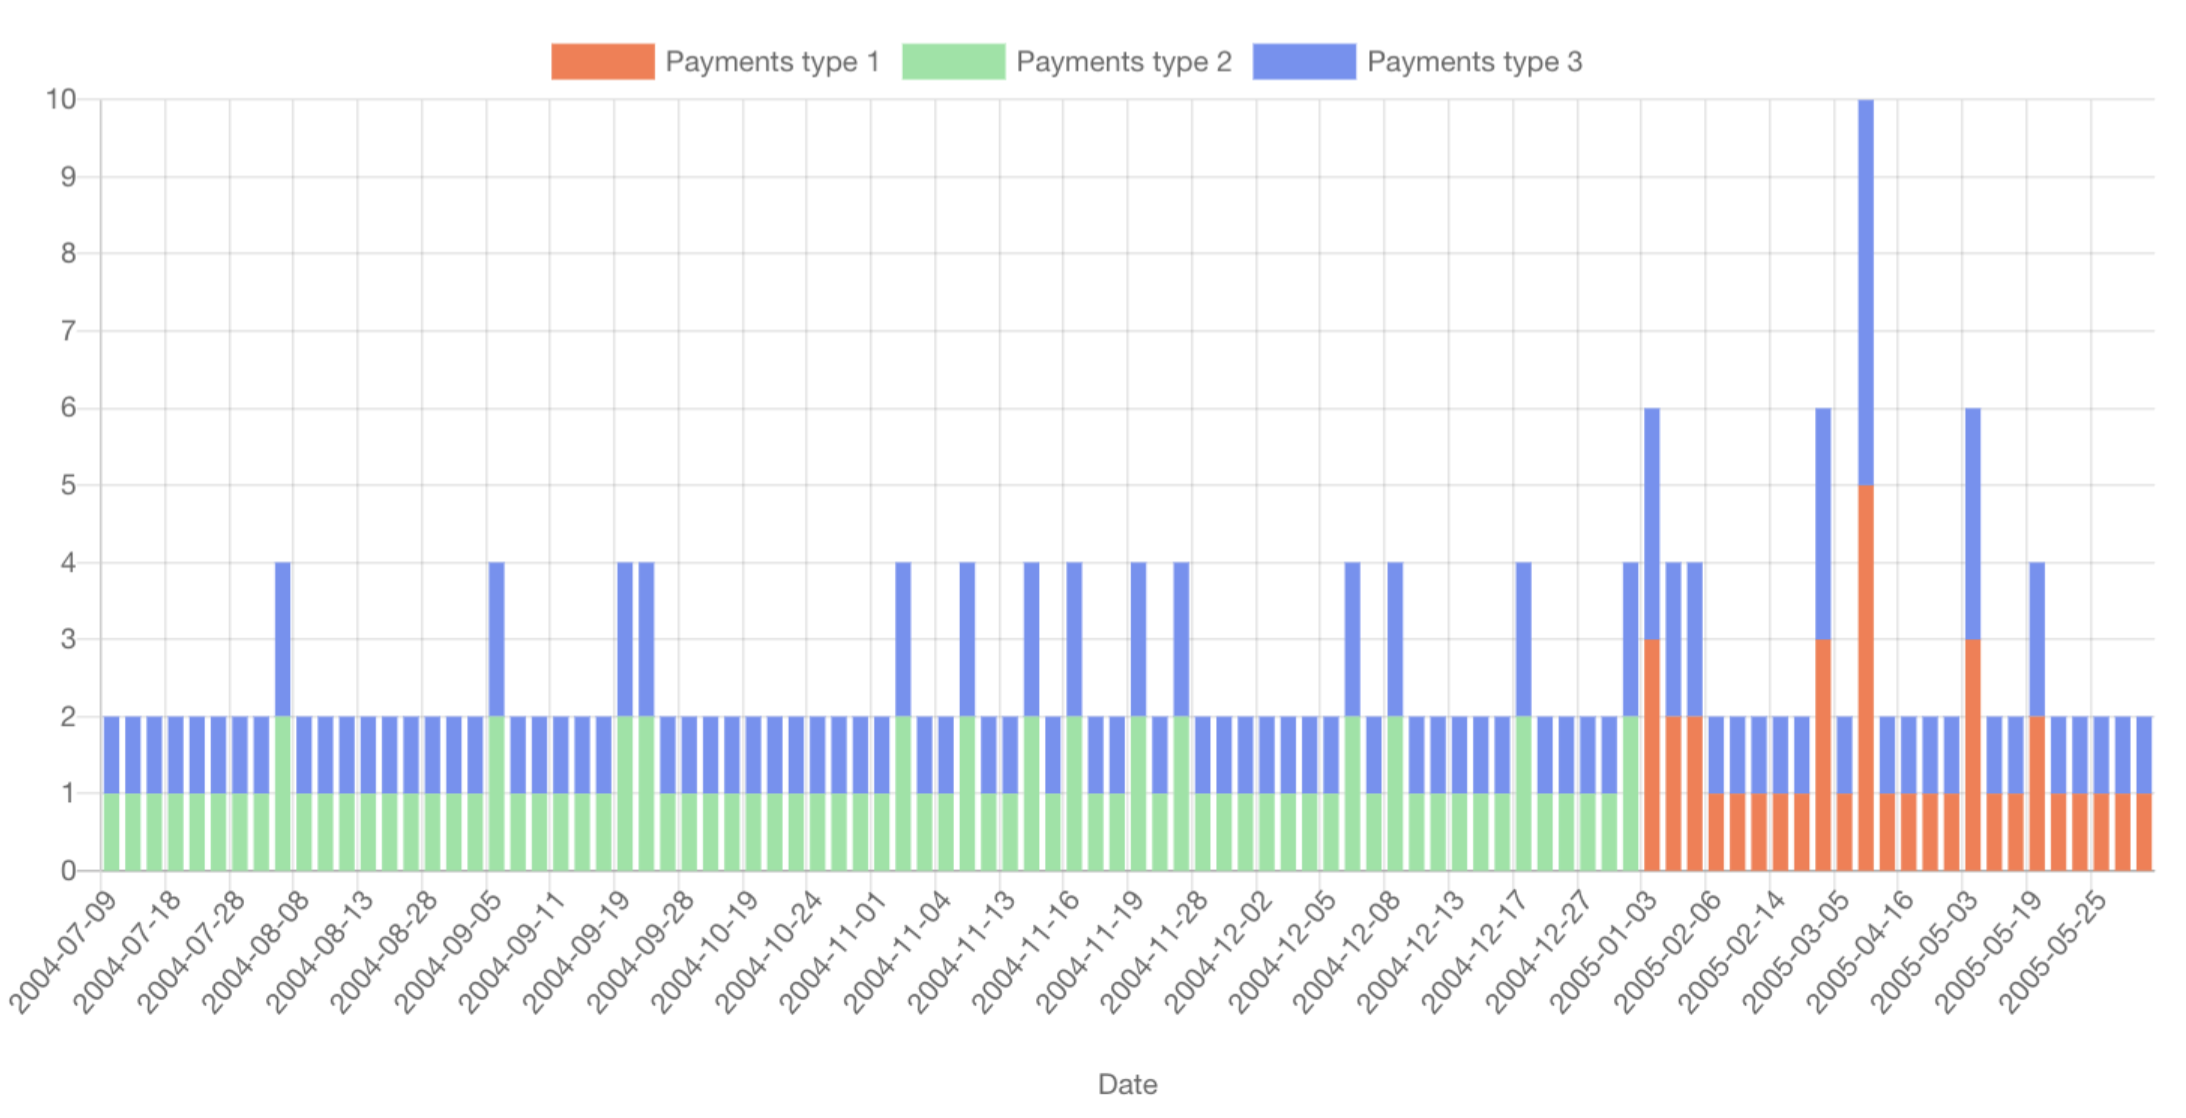
Vertical Bar Chart
In a vertical bar chart, data is represented by vertical bars, with the height of each bar corresponding to the data value it represents.
Usage
- Ideal for showing changes in data over time (e.g., sales over months).
- Comparing different categories or groups side by side.
Customization Options
- Users can customize the color of bars, add labels, decide whether the bars are stacked, and choose the datasets.
- Title and axis labels can be added for clarity.
Interactivity
- Hovering over bars can display specific data values.
- Click on the colors for the display of specific datasets only.