Pie Chart
Structure
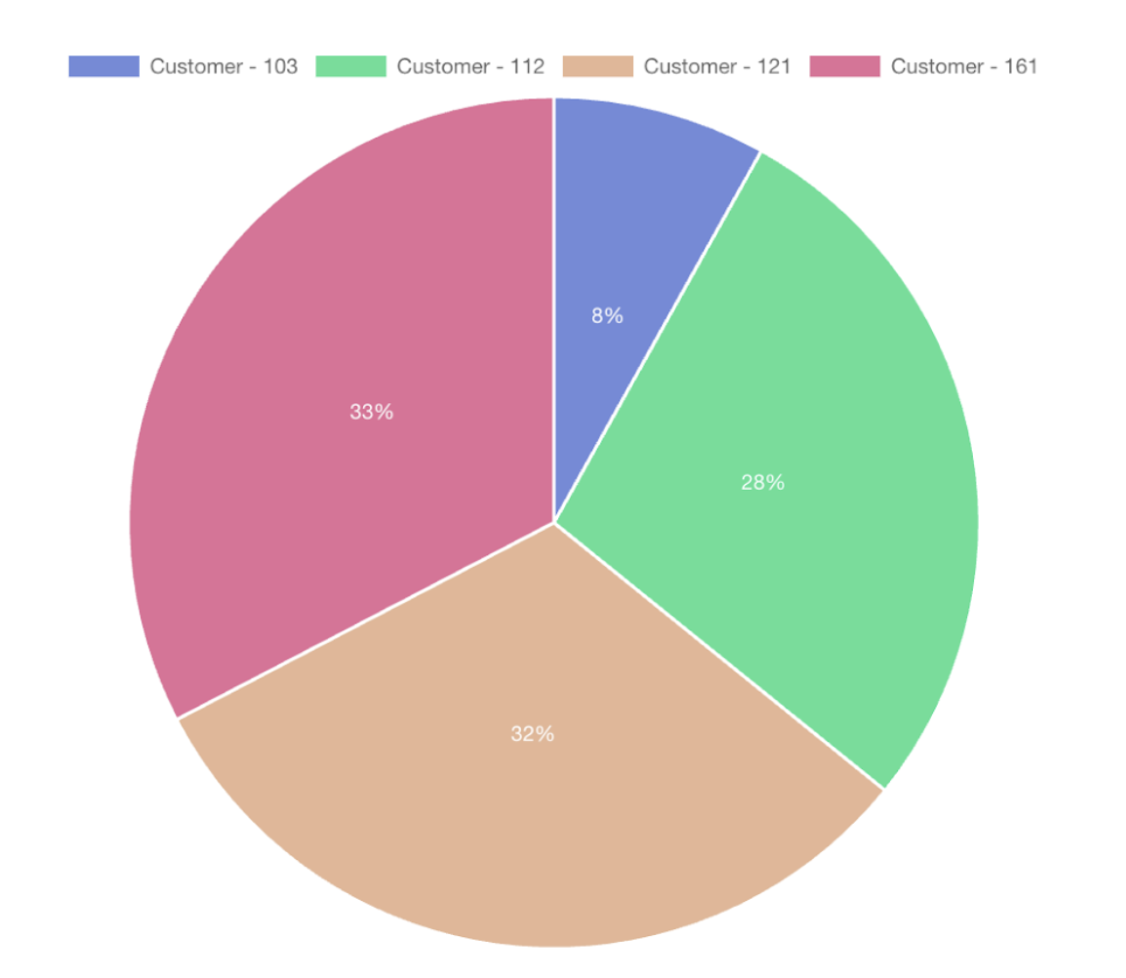
A pie chart is a circular graph divided into slices, where each slice represents a category, and its size is proportional to the quantity it represents.
Data Representation
The entire circle represents the total sum of all data, and each slice is a part of that total, showcasing the contribution of each category to the whole.
tip
- Ideal for displaying a simple composition of data, like market share, survey results, or resource allocation.
- Effective in highlighting the significance of categories in a straightforward, easily comprehensible manner.
Customization Options
Similar to other charts, with options to change line colors, add labels, decide whether the lines are stacked, and choose the datasets.